


Investments in private infrastructure have experienced steady growth in the past few years. Following a relatively short-lived slowdown in fundraising after the global financial crisis (2009-2012), infrastructure fundraising returned to the pre-crisis levels of $40 billion plus per annum from 2013 onward. With the increased stock of private infrastructure funds, the secondaries market became an established part of the infrastructure investment universe. While the cyclical drivers, such as deleveraging pressure and change in regulation, which kickstarted the market in 2008-11, have become less pronounced, the overall maturity of the sector, growth in the number of managers and portfolios are providing continuous support to the deal flow. Secondaries has therefore become an alternative way for investors to access the infrastructure space and it offers unique benefits and challenges.
Compared with primary investments, secondaries opportunities allow investors to evaluate an existing portfolio before making an investment decision and therefore minimise the blind pool risk. Secondaries investments can also complement an institutional investor’s infrastructure portfolio by increasing the diversification across vintage years and mitigating entry valuation risk.
Portfolio benefits are particularly pronounced at the outset of a new programme, as secondaries investments provide immediate diversification and allow for an increase in the investment level and, when acquired at a discount, an immediate valuation uplift, mitigating the J-curve effect. The relatively small size of the industry and the unique nature of infrastructure investments result in certain complexities in the secondaries investment process, implying that a successful secondaries infrastructure investment strategy goes beyond simply acquiring assets at a discount to their stated net asset values.
Infrastructure-specific challenges arise from complicated valuation methods due to asset specific characteristics, lack of public comparables, limited track record of fund managers, as well as limited deal flow when compared to the other segments of the secondaries market.
This chapter assesses the current state of the infrastructure secondaries market, including emerging infrastructure secondaries categories, and reviews the key aspects of the sourcing, due diligence and execution process. It argues that, in spite of the increasing maturity of the market leading to more intense competition, the market continues to favour specialised players with an integrated investment approach in combination with industry-specific knowledge. The chapter also highlights the complexity of the investment process with regards to secondaries infrastructure investments, which limits the feasibility of pure-play investment strategies in this segment of the market.
Market overview
In spite of the recent growth, infrastructure remains a niche segment of the broader secondaries market. Based on Partners Group’s experience, infrastructure dealflow represents between 5 percent and 10 percent of the total secondaries dealflow volume. In contrast, private equity accounts for around two-thirds and real estate around a quarter.
When compared with activity in the primary market over the past seven years (2009-15), infrastructure secondaries deal flow corresponds to around 20 percent to 30 percent of the yearly fundraising volume (that is, typically $4 billion to $8 billion). Only a portion of the deal flow actually reaches closing. Over the past three years (2013 to 2015), we estimate that only between 20 percent and 25 percent of all deals (by volume) transacted. For 2013 to 2015, this represented an effective market size of around $1.5 billion to $2 billion per year.
Until 2015, the infrastructure secondaries market was dominated by traditional LP stake transactions, most of which transacted as single lines. In the second half of 2015, a new infrastructure sub-market emerged, as the funds raised pre-GFC (in 2006-08) started considering extending their maturities with the view to holding fully built out portfolios for the long term instead of selling the assets in the market. To facilitate liquidity to those LPs not interested in long-term continuation, GPs started running liquidity offerings, or tail-end liquidity solutions. A number of such liquidity offerings are expected to actually reach closing, which will result in a significant increase of the market size in 2016 and 2017. Based on Partners Group market intelligence, three to four funds were expected to complete liquidity offerings in 2016, with a total transaction size of between $1.5 billion and $2 billion. The outlook for 2017 is very similar, bringing the total volume of infrastructure secondaries closed in those years up to $3 billion to $4 billion.
Market participants and dynamics
Given the relatively small size of the market, it is not surprising that the number of market participants active in the infrastructure secondaries space remains limited. According to Preqin, the overall number of investors targeting infrastructure secondaries is about 150. Partners Group market intelligence suggests that not all of them are transacting regularly on the market. The breakdown of the investor universe in the infrastructure secondaries space is presented in Figure 13.1.
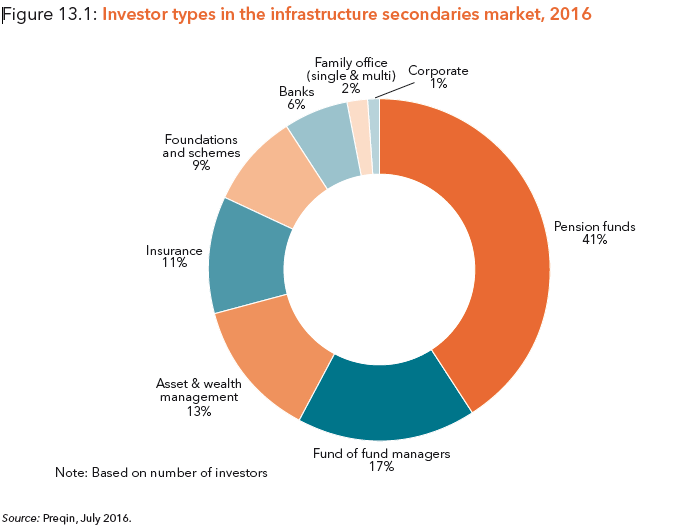
Pension funds represent the largest single group (41 percent) of potential secondaries investors. This reflects the generally high interest of pension fund capital in the infrastructure asset class. Specialised market players, such as funds of funds, asset and wealth managers, are the second largest group. Combined, they represent 30 percent of infrastructure secondaries investors. It is worth noting that this number includes not only dedicated infrastructure secondaries specialists, but other secondaries players that occasionally participate in the infrastructure market. We estimate that where only dedicated infrastructure secondaries specialists are included, the number of specialised market players would shrink to about 15 to 25 organisations. This is consistent with what we observe as initial competition in broadly marketed infrastructure secondaries transactions. The amount of capital raised in the last three years by specialised market players with a significant allocation to infrastructure is estimated at around $6 billion.
Taking into account the estimated annual market size of around $1.5 billion to $2 billion observed and the fact that other market participants (pension funds, for example) have additional dry powder to deploy in the space, it is not surprising to see competition increasing, especially for straightforward transactions, such as traditional single fund LP stakes. The supply-demand dynamics in the infrastructure space have changed since secondaries market activity started eight to ten years ago. In 2008–2011, a significant number of sellers (in particular, those driven by liquidity or regulatory factors) and only a handful of professional buyers were capable of evaluating infrastructure secondaries transactions. From 2014 onwards, the number of motivated sellers has shrunk and, at the same time, new secondaries players have entered the market. For the two reasons given below, this dynamic should not come as a surprise:
- Most investors seek to increase allocation to infrastructure.
- The infrastructure fund landscape is still relatively narrow and does not lend itself towards regular portfolio management exercises by LPs, which would support a higher transaction
Dmitriy Antropov is senior vice-president of private infrastructure at Partners Group and co-leads the firm’s worldwide integrated infrastructure investment activities, which include primary and secondaries fund investments, as well as joint investments. He has been with Partners Group since 2008 and has 12 years of industry experience. Antropov holds a PhD in world economics from Financial University in Moscow. He is also a certified financial risk manager.

 If you do not receive this within five minutes, please try to sign in again. If the problem persists, please email: